
 This menu is used to indicate what should be shown on the screen. The majority of submenus are equivalent to one of the buttons on the main screen.
View
 This submenu has several options:
- Plan
- Elevation
- Axonometry
- 4 view ports
In fact, we have a few more choices as buttons on the left.
Render
WinTess3 is not a program designed to perform a quality “rendering”. However, for the purposes of checking the smoothness of the surfaces generated, it owns a Render module where you can manipulate view, lighting and night effect.
 The Render window allows you to modify lighting level of ambient light, a light located below and another light located above the membrane. It also allows to project a shadow on the ground. The ground can be displayed or not, in addition to deciding Z level. By default this value is zero, but can be modified. There is also a mode for day/night that allows you to see a different aspects of the membrane.

Finally, if you want to project render of the structure on top of an image, in order to create a visual impact, we can do this by checking background image box. As soon as we check it, a new box appears and we can choose the background image and we can adjust the structure on it.
This menu is equivalent to the button on the left with the text “Render”.
This option, which is equivalent to the ![]() button, used to quickly print mesh as displayed on the screen. If what you want is a screen dump, it is better to use the resources of the system through the PrintScreen button that copies the contents of the screen to memory. Then, “Paste” (CTRL-V) can place this image in any other program: word processing, graphics, etc.
button, used to quickly print mesh as displayed on the screen. If what you want is a screen dump, it is better to use the resources of the system through the PrintScreen button that copies the contents of the screen to memory. Then, “Paste” (CTRL-V) can place this image in any other program: word processing, graphics, etc.
Symmetry
There are three buttons  among the buttons on the left.

These buttons serve to duplicate the image by symmetry. This duplicate uses a vertical symmetry planes XZ and YZ.
However, these planes can also be located more or less away from the origin. Through this menu (image on the right), we can determine the distance of these planes with respect to the center of coordinates.
Initial form
This menu, like the button ![]() , draws the initial form (non-deformed by the actions) of the structure.
, draws the initial form (non-deformed by the actions) of the structure.

The bars in initial form appear in red. This is a toggle type menu, that means clicking it again clears the initial form and leaves only the present form (deformed by the actions) on the screen.
If, at a given moment, when activating this menu or button don’t show anything, it means that the initial and the final form coincide. This often happens before applying loads to the structure.
Contour lines
 Contour lines of a membrane serve, among other things, to verify that there is no ponding due to deformations by snow. This is very important, and if there is ponding, water from rain or snow melting, will not be removed by gravity, causing more buildup until the structure collapses.
Separation of contour lines can be adjusted a value in the menu Help | Options.
This menu is equivalent to the button ![]() on top toolbar.
on top toolbar.
Sun shadow
 It is an application of a very specific use.
We can access this application also through the button on the right ![]() .
.
It allows us to view the shadow that our structure produces on a horizontal plane. To calculate this, we need to know a series of data:

- latitude of the place where the structure is
- day of the year
- daylight (not the official time)
- position of the North with respect to the principal axis XY
- Z coordinate of the horizontal plane we wish to draw this shadow.
Rain flow
 With this button, we can simulate the path of the rain water on the membrane. For more information see button on the right: Rain flow.
Axial forces
This graph shows the value of the axial forces of the structure bars in a visual way: membrane, cables and tubes.
This visual tool gives us an idea of the axial force on each bar with the colour and the thickness of the line. There is also a checkbox “Numbers” to draw numerical values for each bar.
This menu is equivalent to the button on the left with the caption “Axial forces”.


Ratio
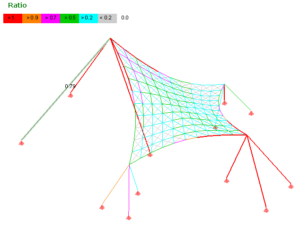
![]() The graph of ratios is one of the most useful tool in the Analysis state. This graph shows each bar with a color that indicates if the bar meets with the global safety factor in supporting the actions it is subjected.
The graph of ratios is one of the most useful tool in the Analysis state. This graph shows each bar with a color that indicates if the bar meets with the global safety factor in supporting the actions it is subjected.
It uses a color code that goes from 0 to 1, leaving the red color (with a trace of 2 pixels) for the values above 1.
The value 1 means that the stress on bar multiplied by the global safety factor of this material is equal to the permissible stress of the material, that is:
Ratio = GlobalSafetyFactor x Tbar / (Tmaterial)
Values greater than 1 are inadmissible, while values less than 0.5 show that the structure is oversized.
This menu is equivalent to the Ratio button on the left.
Moments
 We see moments graphic only in the structures with rigid bars.
The moment diagram shows by combining the bending moments corresponding to the two main local axes. Therefore this diagram does not have be in one plane. The fact that the program only supports rigid bars formed by tubes of circular cross-section (the principal local axes do not have too much importance) facilitates the presentation of unique moment.
This menu is equivalent to the button on the left with the text “Moments”
Sections
 ‘Sections’ graph shows us thickness of the section line of each bar. It is important to remember that the section of membrane is measured in meters wide, while the section of the cables and tubes is measured in cm².
Applied loads
 When we apply loads to the structure (wind, snow, self weight, etc. ) is important to view them graphically in order to avoid serious errors that are easily detected in graphic form.
Through this menu you can see the total loads applied to the structure. It is the same as pressing the button on the left called “Total loads”.
However it is important to know that there are five buttons on the right: “W”, “S”, “Pr”, “SW”, “X” that allow you to view five types of applied loads to the structure:
W –> Wind
S –> Snow
Pr –> Internal pressure
SW –> Self weight
X –> External loads applied at the nodes
Reactions and unbalanced forces
 The reactions are imbalances that occur in the structure at those nodes that cannot be moved. Reactions must be zero at free nodes, since otherwise the structure is not in balance.
If we want to know the X, Y, Z components of the reactions at a node, we have to click on it to obtain the information table of the node with displacement (free nodes) or reactions (fixed nodes).
Numbers
This menu, which is active only in certain circumstances, has the same utility as the checkbox marked “Numbers”
Color
This menu, which is active only in certain circumstances, has the same utility as the checkbox marked “Color“
